Tips for Debugging#
When using any library that deals with callbacks, it can sometimes be difficult to debug issues that occur in the callbacks. This is because the stack trace that you see when the error occurs has a number of additional frames that are not relevant to the error, but rather are part of the psygnal's callback handling logic.
Using rich to Improve Stack Traces#
The library rich provides a convenient way to suppress these irrelevant frames and highlight only the relevant ones, making it much easier to determine which part of your code is causing the error.
Example#
Take the following code that runs into a ZeroDivisionError inside of callback some_func, when the signal obj.sig is emitted with the value 0:
from psygnal import Signal

class MyClass:
    sig = Signal(int)

def some_func(x: int) -> None:
    print(1 / x)

obj = MyClass()
obj.sig.connect(some_func)
obj.sig.emit(0)
Here's an example of a standard Python (3.11) stack trace that you might see when running this code:
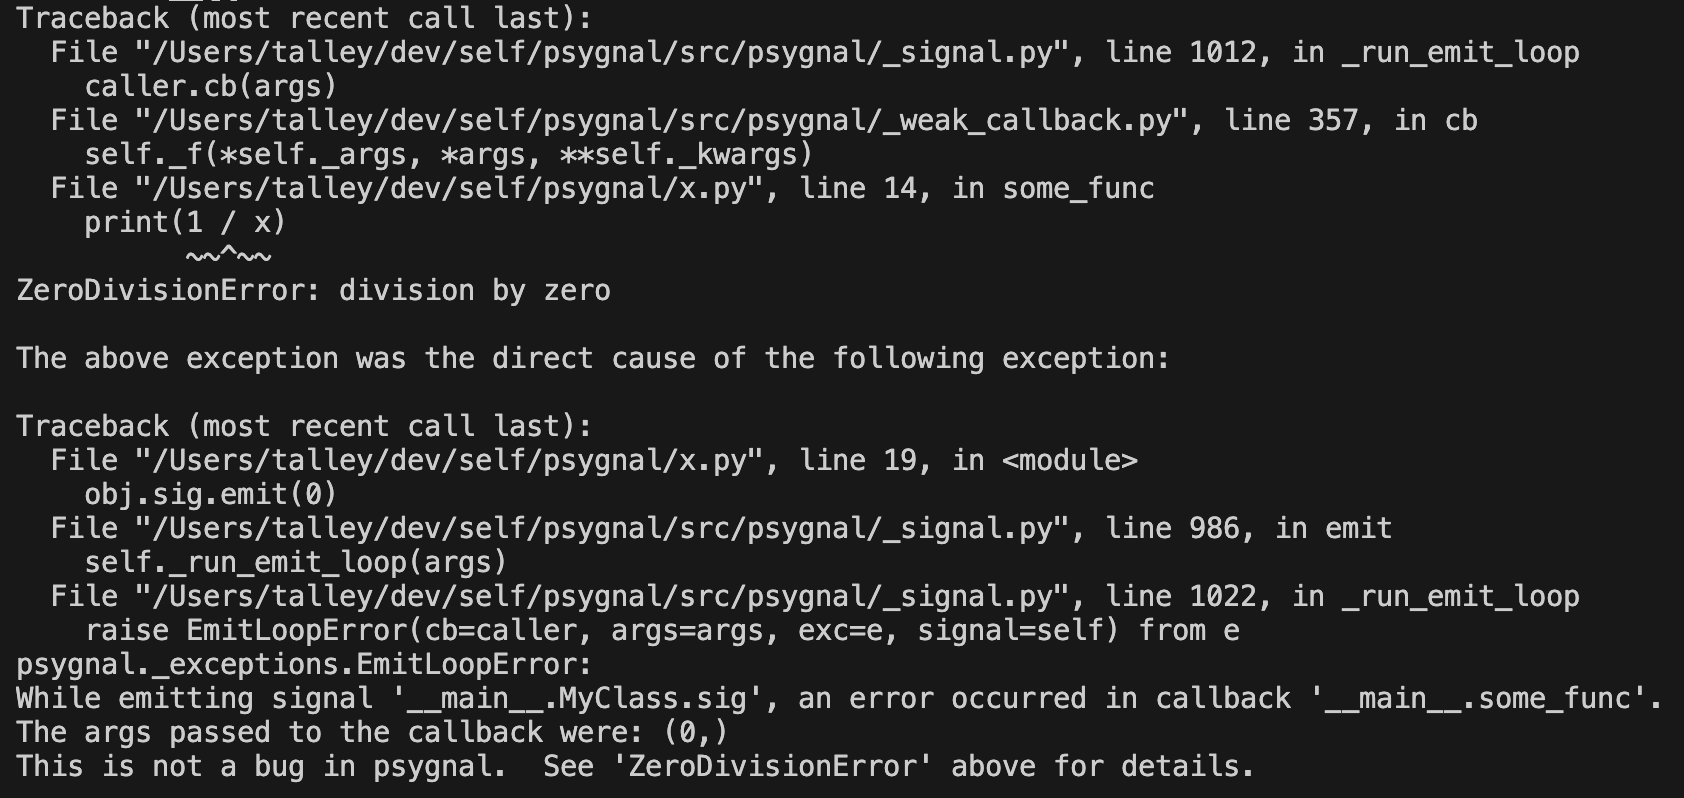
All the information is there, but you need to ignore all the lines that come from psygnal, and focus on the lines that come from your own code. That can be visually challenging, especially if the stack trace is longer than this one.
Now, add the following code somewhere at the top of your program:
import rich.traceback
import psygnal
rich.traceback.install(show_locals=True, suppress=[psygnal])
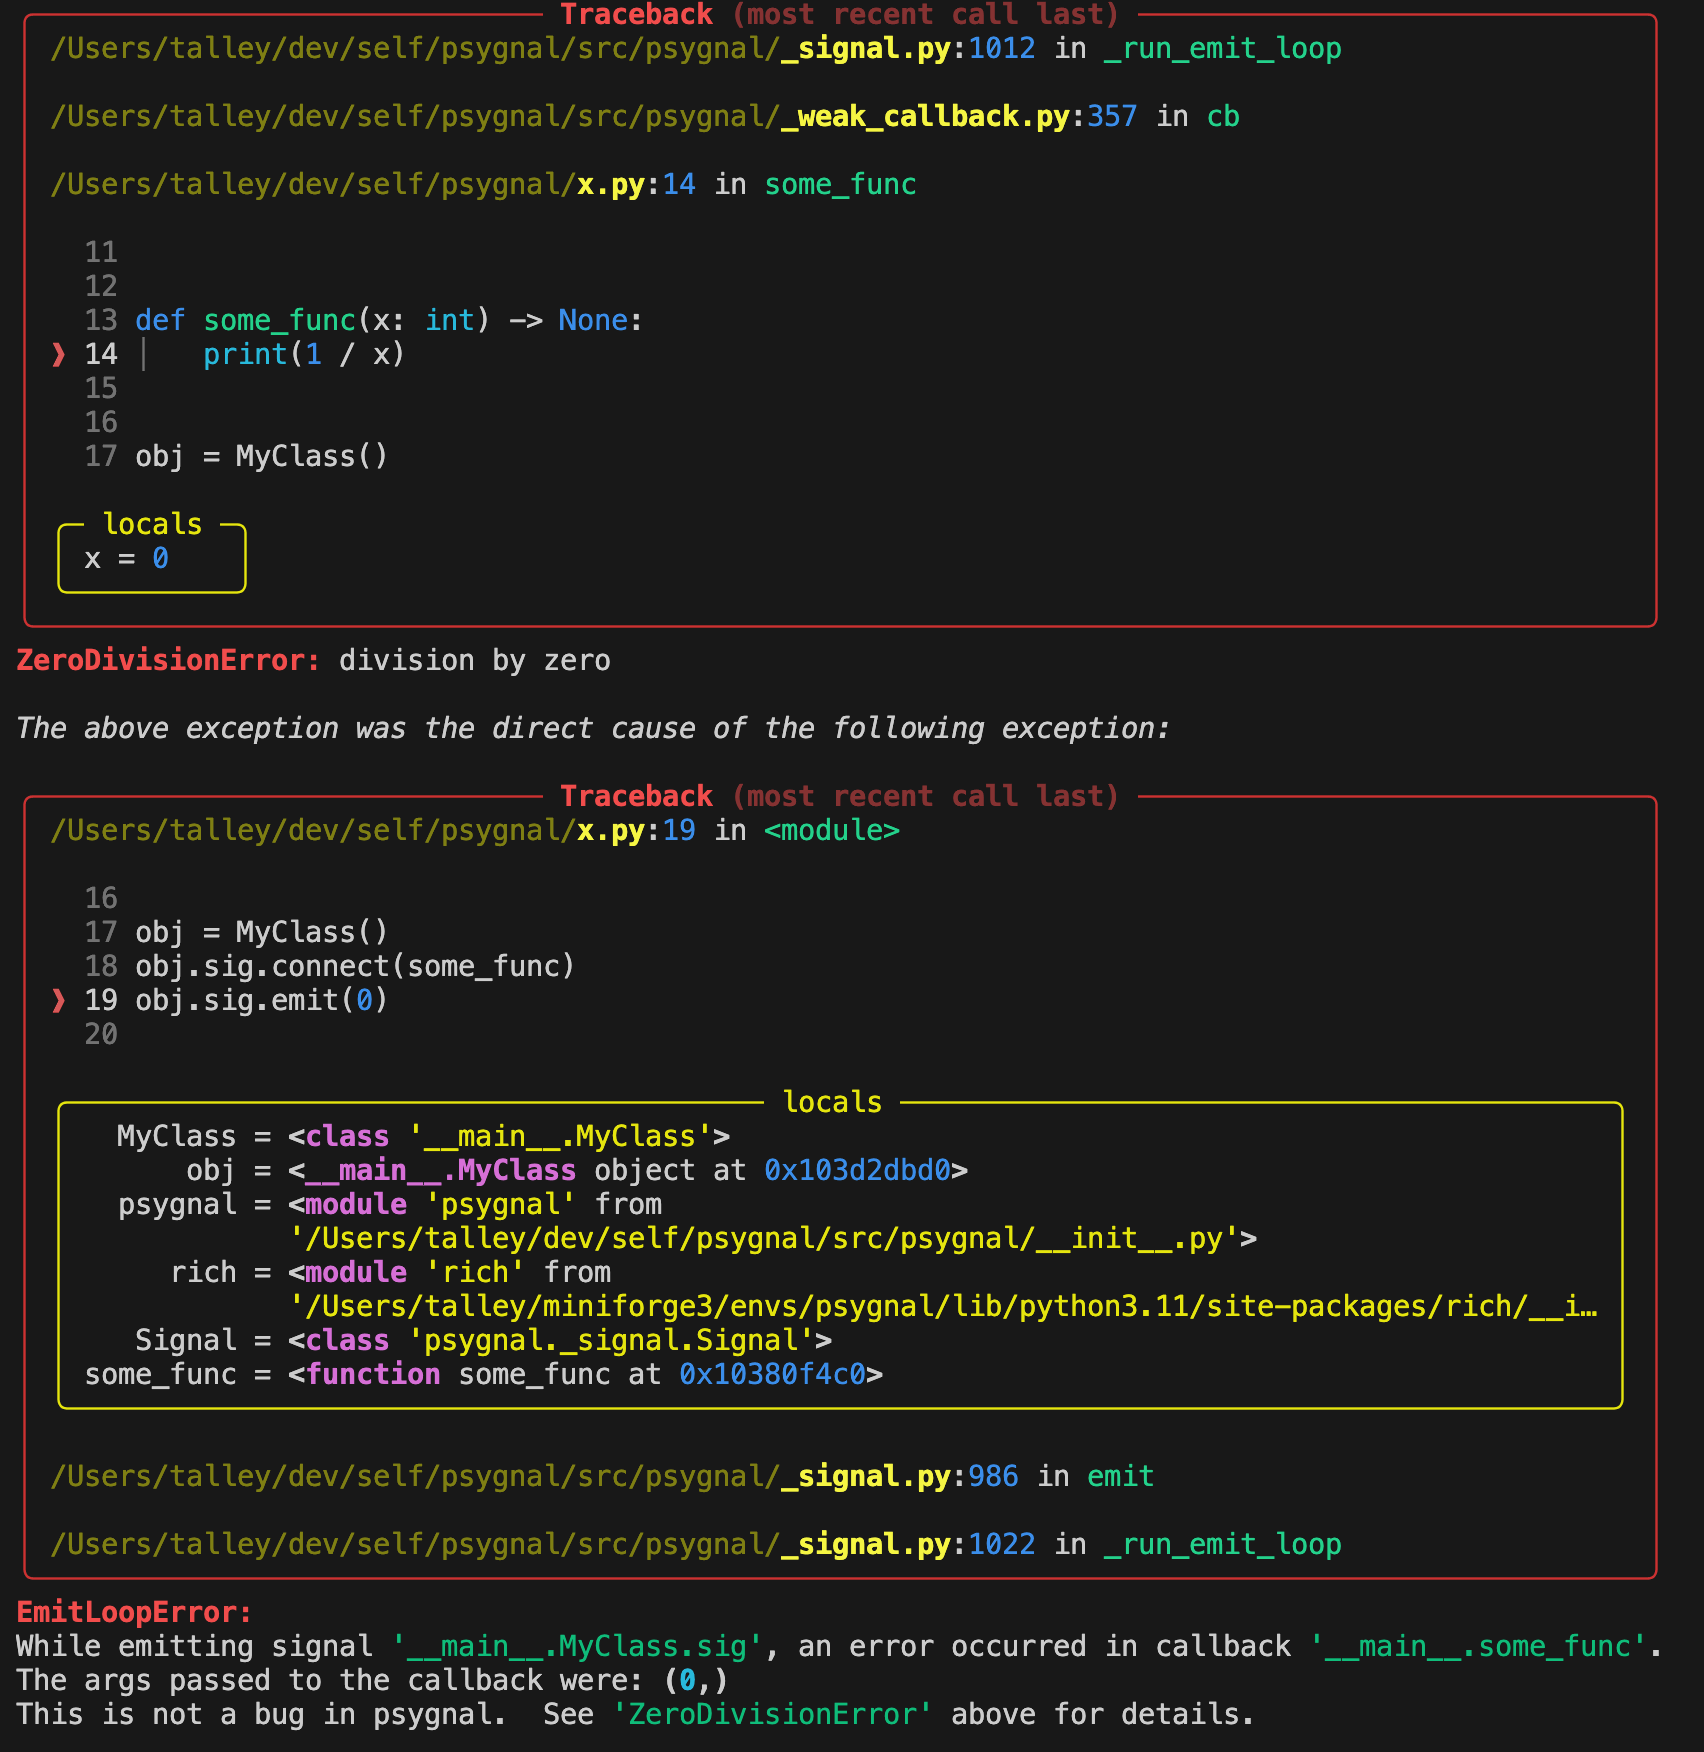
If you run the code again, you'll see a much more helpful stack trace.
In addition to coloring the output, providing suppress=[psygnal] reduces info from frames that are part of the psygnal library, making it much easier to see where the error occurred in your own code. Specifically, it draws attention to the two places in the code that you can do something about:
- The line in the callback that caused the error:
print(1 / x) - The emission of the event that triggered the callback:
obj.sig.emit(0)